How The Hague built a steering wheel for climate action.
Case summary
The Hague is a major Dutch city of ~550,000 inhabitants, driving one of the Netherlands' most ambitious climate agendas with a clear focus on measurable results.
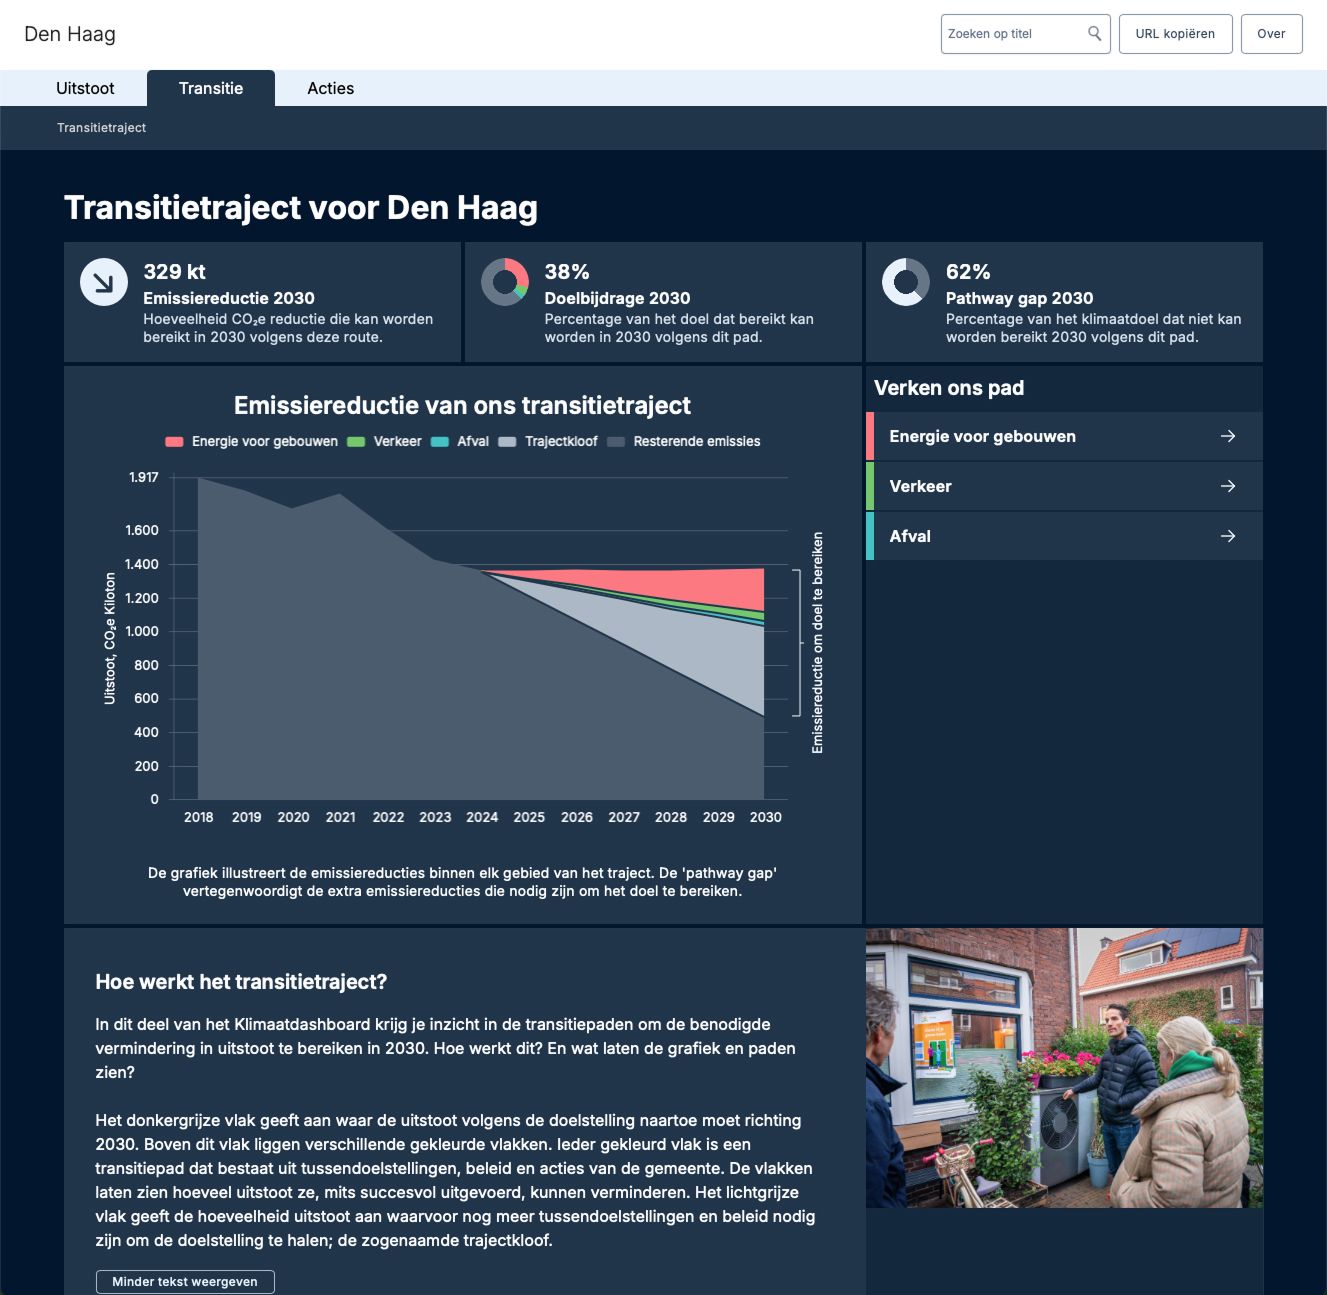
In 2024, the city council launched a formal initiative for stronger climate reporting, answered by a public climate dashboard built on the ClimateView platform.
Using a ClimateView dashboard as a single source of truth, the city now connects emissions data, interventions, and long-term targets — making its climate strategy fully transparent and accountable.

"Internally, the key benefit is that the dashboard turns climate reporting into a strategic steering instrument."
Thomas Hes
Data & Sustainability Coordinator
Geemente Den Haag
Looking back at the launch of The Hague's public climate dashboard: What was the most important insight you gained from making your climate strategy transparent and data-driven?
Before implementation, the expected benefit was mainly a better understanding of historical emissions. That insight was valuable, but the most important outcome was broader.
The dashboard helped break down the climate transition into measurable transition elements: smaller puzzle pieces in the city that contribute to decarbonisation, such as retrofitting homes or more cycling.
That shift made climate strategy much more concrete. Instead of discussing emissions reduction only at a high level, the conversation can now focus on the underlying changes that need to happen. Which transition elements are moving in the right direction? Where do additional subgoals need to be defined? And where may further action be needed?
This creates a clearer basis for committing to a decarbonisation pathway and adjusting that pathway over time based on data. It has also opened up new possibilities for the city council to discuss climate action in a more targeted and informed way.

“For inhabitants of The Hague and other stakeholders, the dashboard creates a structured place where information about the city’s climate transition comes together.”
Thomas Hes
Data & Sustainability Coordinator
Gemeente Den Haag
For the City of The Hague, what are the key benefits of using a public dashboard to track and communicate climate action — both internally and towards citizens and stakeholders?
Internally, the key benefit is that the dashboard turns climate reporting into a strategic steering instrument. Structural and data-driven reporting has been an important topic within both the city council and the municipal organisation in recent years. In 2024, the city council introduced the initiative proposal “Stuur op het klimaat” — translated as “A Steering Wheel for the Climate” — which called for stronger climate reporting and clearer, measurable results.
The dashboard helps respond to that need. It moves climate reporting beyond a list of completed projects supported by a few indicators. Instead, it shows how the municipality is addressing climate action through a wide range of interventions, while also encouraging concrete goals to be defined and monitored.
That gives both the city council and the municipal organisation better handles to actively steer the climate transition. A written report can describe progress, but the dashboard makes it easier to connect ambition, transition elements, interventions, and monitoring in one place.
For inhabitants of The Hague and other stakeholders, the dashboard creates a structured place where information about the city’s climate transition comes together. Some emissions diagrams may still be challenging to understand without explanation and context, but the dashboard has real potential to make emissions less abstract. The intervention overview is especially valuable here. It offers a single source of truth about what the municipality is actually doing, from policies and subsidies to projects and neighbourhood initiatives. For some people, that will be much more accessible than a large policy document.
The municipality is also researching whether non-emission-related sustainability transition elements and interventions could be added to the dashboard, for example on climate adaptation. Whether this is possible, and how it should be done, is a matter for study in the coming years.

Many cities struggle to turn climate plans into concrete action. How has working with ClimateView helped The Hague connect strategy, intervention, and implementation?
Working with ClimateView has helped by giving the climate strategy a clearer structure. Long-term emissions targets can now be connected to measurable transition elements and to the concrete actions the municipality is undertaking in relation to them.
The system has only been online for a few months, so it is still too early to assess how political, executive, and organisational actors will use these insights in practice. But it has already made the link between strategy, intervention, and implementation easier to discuss.
An important next step is helping decision-makers set measurable targets for the transition elements. This requires political choices about priorities — for example, between public transport, electric cars, and cycling — as well as clear input from the organisation on what is realistically achievable.
To support this, CE Delft modelled and calculated the expected emissions trajectory of The Hague if all current interventions are delivered and external factors develop as planned. That analysis helps create a realistic basis for measurable target-setting. The process is still ongoing, but facilitating goal-setting in this way is already a significant step towards connecting strategy with implementation.
The Hague's transition in numbers
46%
Reduction in emissions since 1990 — despite significant city growth.
7,000
Homes insulated in 2024, with nearly 10,000 households lifted out of energy poverty.
115+
Partners collaborating through 44 climate deals under the Hague Climate Agreement.
Stakeholder engagement is often a challenge in climate planning. How did you involve different departments and partners in the process, and what difference did that make?
A cross-departmental working group was established with experts from several parts of the municipality, including housing, mobility, local business, waste management, the energy transition, data, and emissions.
The project would have been less impactful if it had been approached as the responsibility of one department only. Climate action cuts across many policy domains and municipal activities.
By involving different departments from the start, the project created shared ownership and made sure the dashboard reflected the breadth of municipal climate action, rather than the perspective of a single policy area. That helped develop something that can bridge policy and domain gaps, and that can be useful across the organisation.
The council initiative “A Steering Wheel for the Climate” — also helped significantly, because it called for many of the functions that the dashboard could provide.
If you could share one message with other cities currently working on their climate strategies, what would you encourage them to focus on first?
Other cities should consider starting with a transition-based structure for their climate strategy. This could be the open-source transition element framework behind the ClimateView dashboard, or a similar method such as a climate budget.
The reason is that this shifts the focus away from day-to-day policy domains and individual interventions. Instead, it forces the city to think and report more integrally about which transitions are actually needed to achieve climate neutrality.
A dashboard like ClimateView can be very helpful in supporting that strategy with data and in bridging organisational gaps. But the biggest strategic value lies in the transition-focused approach itself.
A structure that can be drilled down, made increasingly concrete, goal-driven, and actionable helps demystify the climate transition for everyone involved. It makes climate strategy less abstract, gives decision-makers clearer choices, and creates a stronger basis for steering progress over time.